URBAN STRUGGLES: LIVELIHOOD AND HEALTH ISSUES OF WOMEN STREET VENDORS IN TRIVANDRUM
September 30, 2025SELF-AWARENESS AND ACADEMIC ACHIEVEMENT IN SCIENCE OF HIGH SCHOOL STUDENTS IN TIRUNELVELI DISTRICT
September 30, 2025URBAN STRUGGLES: LIVELIHOOD AND HEALTH ISSUES OF WOMEN STREET VENDORS IN TRIVANDRUM
September 30, 2025SELF-AWARENESS AND ACADEMIC ACHIEVEMENT IN SCIENCE OF HIGH SCHOOL STUDENTS IN TIRUNELVELI DISTRICT
September 30, 2025Sparkling International Journal of Multidisciplinary Research Studies
UNDERSTANDING INDO-CHINA TRADE: TRENDS, PATTERNS, CHALLENGES AND FUTURE DIRECTIONS
*Meenakshi S Raj, & **Thushara George
*Alumnus, Department of Economics and Centre for Research, St Teresa’s College (Autonomous), Ernakulam, Kerala, India.
**Professor and research guide, Department of Economics and Centre for Research, St. Teresa’s College (Autonomous), Ernakulam, Kerala, India.
Abstract
This study focuses on the trends and patterns of Indo-China trade relations. The export and import data between India and China from the 2000s to 2023 have been considered for analysis. The research confirms that China’s exports are generally high, primarily due to its concentration on manufactured products, whereas India mostly exports primary goods. The study also highlights that in 2020, when India faced an economic setback due to the lockdown, imports from China increased significantly, surpassing exports. This was largely because India’s pharmaceutical industry depended heavily on raw materials sourced from China. Engineering goods, iron ore, organic and inorganic chemicals, and petroleum products are among the major commodities imported by India from China.
Keywords: india, china, import, export, directions, and trade.
Introduction
India and China are two of the largest economies with ancient civilisations. They have a long history of trade relations, starting from the time of the Silk Road era. Over the years, commercial transactions between India and China have been influenced by cultural ties and economic reforms. At present, bilateral trade between India and China in 2024 is US$118.40 billion against US$113.83 billion in 2023, showing a growth rate of 4%. Major items exported to China from India are cotton, tea, coffee, oil seeds, marine items, etc and major items exported from China include machinery, nuclear reactors, organic chemicals, plastic and articles and fertilisers, which account for US$31.35 billion, US$22.47 billion, US$11.49 billion, US$5.66 billion, US$2.25 billion, respectively, in 2024.
Review of Literature
Anil A, in his article Impact of COVID-19 on India-China trade (2020), gives an overview of the effect of COVID-19 on India-China relations in all aspects. It examines India’s potential for economic competitiveness as compared to a collaborative trade model using the descriptive term CHINDIA. The analysis demonstrates that India had turned to China for the supply of 12 essential medicines during the pandemic, indicating that a possible trading partnership may be beneficial for India’s economic future. Indo-China relations have been characterised by stronger political ties and trade relations since the Most-Favoured-Nation (MFN) status that was enacted in 1984. The trade deficit India had with China, by way of imports heavily outweighing exports, had specific economic challenges. Industries traded with China, including, but not limited to, electronics, organic chemicals, and plastics, had significant trade variance during the COVID-19 pandemic. COVID-19 highlighted India’s reliance on China for healthcare and indicates the significance of future trade relations for healthcare resilience and security.
Akeel Ahmad Dar and Dr Shakshi Mehta, in their work titled A study of India-China trade relations (2020), highlight the notable imbalance in bilateral trade by examining the changing trade relationship between India and China over the past 20 years. A rising trade deficit is due to India’s limited exports to China and China’s increase in exports to India. Between 2002 and 2014, trade between India and China has risen from $4.94 billion to $70.6 billion. Even though there was a trade imbalance of $46.6 billion in 2016, China was able to maintain a huge surplus. This is because China’s economy is mainly based on manufacturing, whereas India’s economy is based on the trade of services. After China joined the WTO, China became India’s biggest commercial partner, which resulted in an imbalance in bilateral trade. Due to the ongoing trade deficit, India has faced a lot of economic difficulties, and to improve its export competitiveness has to be improved. There is efficient potential for joint investments in a number of areas, such as technology and renewable energy, under China’s “Go Global” strategy and India’s manufacturing aspirations. The governments of both countries should implement a unified strategy that harmonizes trade policy with industrial objectives in order to maximize trade ties and promote a more equitable economic partnership.
Sunandan Ghosh, Manmohan Agarwal and Adrita Banerjee, in their article India-China Trade: Asymmetrical Developments and Future Prospects (2019), tries to give an overview of the evolution and evaluates the changing composition of trade between India and China over the period of 1983–2017. As per the article, Indian exports mainly contain both manufacturing and agricultural goods and are now slowly migrating to intermediate commodities, while Chinese exports are fully based on manufacturing, mainly finished equipment goods. Also, both nations export the items in which they possess a comparative advantage to the other. Using vector error correction estimation, it is identified that India’s exports to China are connected with Chinese industrial value-added goods, whereas China’s exports to India are reliant on household consumption expenditures in India. To examine the potential for trade between China and India, the proportion of each nation’s total exports are considered, and it can be concluded that diversification is important for future trade growth and that Indian input exports to Chinese industries must significantly alter to take into account the shifting industrial structure of China.
Rajani Das in their article on a study of the trade relation between India and China (2018), examines the trade relation between India and China along with their integration into the global economy, trade deficits, historical background, and potential future collaboration. The economic ties are affected by issues including trade imbalances, border conflicts, and regulatory hurdles. As per the report, both countries stand to gain from improved cooperation and strategic alliances. The trade deficit is made worse by India’s excessive dependence on Chinese imports, especially for highly technical items. This has to be solved to achieve long-term stability. There are many obstacles standing in the way of Indian businesses entering the Chinese market, especially in industries like IT services and medicines.
Statement of the Problem
India’s trade deficit has been rising due to the its dependence on import from China. India has consistently ranked trade deficit with each year its imports rising more than its exports. India has ranked a bilateral trade with China and has reached a record of 136.2 US billion. The study focusses on analysing trend and pattern of Indochina trade relations.
Objective of the Study
To analyse trend and pattern of Indo-China trade relations
Methodology
The methodology mainly consists of secondary data, literature review, news articles and other publications which provide insights into the growth and challenges of Indo-China trade relations. Bar graph is used to illustrate the objective. Simple statistical tools are used for analysis such as growth rate, bar graph, line graph, etc. The data required for study are taken from various sources and their various issues. (i)Embassy of India, (ii) Ministry of commerce, (ii) various reports.
Analysis
Trend and Pattern of Indochina Trade Relations
Export Data from India to China
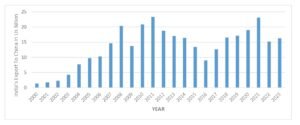
Fig. 1 India’s export to China from 2000 – 2023
The above figure shows the rate of change in India’s exports to China from 2000 to 2023. In 2000, India’s export to China was 1.35 US billions. It increased to 1.70 in 2001 and increased to 2.27 in 2002. It almost doubled in 2003, reaching 4.25. In 2004, it reached more than triple the amount in 2002, reaching 7.62 US billion. In 2005 it reached to India’s export to China reached almost 9.76 US billion. In 2006, it made a small increase by reaching 10.27 U S billion. In 2007, it increased to 14.61. In 2008, it increased to 20.3 US billion, making an increase of 5.69 US billion compared to last year. In 2009, it showed a decline of 6.6 US billion compared to last year, reaching 13.7 US billion. In 2010, it showed an increase of 7.1 US billion, reaching 20.8 US billion. In 2011, it showed a slight increase of 2.5 US billion reaching 23.3 US billion. In 2012, it made a decline of 4.6 US billion compared to last year, reaching 18.7 US billion. In 2013, it again dropped to 17 US billion, making a decline of 1.7 percent compared to last year. In 2014, it showed a small decline of 0.6 US billion compared to the previous year, reaching 16.4 US billion. In 2015, it declined by 3 US billion, reaching 13.4 US billion, and in 2016 showed a decline of 4.44 US billion and reached 8.96 US billion. In 2017, it declined to 12.66 US billion. In 2018, it increased to 16.49 US billion, an increase of 3.83 US billion compared to last year. In 2019, it showed a decline of 0.63 US billion compared to last year, reaching 17.12 US billion. In 2020, it increased to 18.95, showing an increase of 1.83 US billion. In 2021, it showed an increase of 4.1 US billion compared to last year, reaching 23.05 US billion. In 2022, it reached 15.15 US billion, showing a decline of 7.9 US billion. In 2023, it increased by 1.08 US billion than the previous year and reached 16.23 US billion.
Import Data from China to India
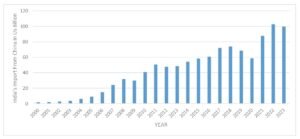
Fig.2 India’s import from China
The above figure shows the rate of change in India’s import from China from 2000 to 2023. In 2000, India’s import from China was 1.56 US billions. It increased to 1.90 in 2001 and increased to 2.67 in 2002. In 2003, it reached 3.34 an increase of 0.67 US billions in 2004, it reached to almost double the amount in 2002, reaching 5.93 US billions. In 2005, it reached to India’s import from China reached almost 8.93 US billion. In 2006, it increased by reaching 14.58 U S billion. In 2007, it increased to 24.05 US billion, showing an increase of 9.47 US billion compared to the previous year. In 2008, it increased to 31.6 US billion, making an increase of 7.55 US billion compared to the previous year. In 2009, it showed a decline of 1.9 US billion compared to the previous year, reaching 29.7 US billion. In 2010, it showed an increase of 11.2 US billion, reaching 40.9 US billion. In 2011, it increased to 50.5 US billion, an increase of 9.6 US billion. In 2012, it made a decline of 2.8 US billion compared to last year, reaching 47.7 US billion. In 2013, it increased to 48.4 US billion, making an increase of 0.7 percent compared to the previous year. In 2014, it showed an increase of 0.7 US billion compared to the previous year, reaching 54.2 US billion. In 2015, it increased by 4 US billion, reaching 58.2 US billion, and in 2016, it showed a slight increase of 2.45 US billion and reached 60.65 US billion. In 2017, it increased to 72.04 US billion. In 2018, it showed a slight increase of 1.83 US billion compared to last year, reaching 73.87 US billion. In 2019, it showed a decline of 5.52 US billion compared to last year, reaching 68.35 US billion. In 2020, it declined to 58.71 US billion, showing a decline of 9.64 US billion. In 2021, it showed an increase of 28.94 US billion compared to last year, reaching 87.65 US billion. In 2022, it reached 102.63 US billion, showing an increase of 14.98 US billion. In 2023, it dropped by 3.04 US billion from the previous year and reached 99.59 US billion.
Trend and Pattern of Commodity-wise Export and Import from India to China
Commodity-wise Export from China to India in 2020
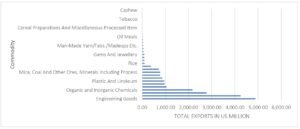
Fig.3 Total Exports Apr’20-Mar’21
The above figure shows the export from India to China in the year 2020. The total amount of meat and dairy products, tobacco and coffee falls below 1US million. The amount of coffee, jute, cereal preparation, and handicrafts are exported at an amount ranging between 10.31 to 3.91US million. Cotton yarn, mica, coal, and electronic goods were exported in amounts of 717,7,773.08,777.34 US million, respectively. Marine products, plastic and spices were exported at amounts of 869.92,956.86,970.44 US million, respectively. Petroleum products were exported in the amount of 1043.40 US million. Organic and inorganic products, and others were exported by an amount of 2169.14 US million and 2778.65 US million, respectively. Iron ore and engineering goods were exported at an amount of 4245.45 US million and 4884 US million, respectively. The most largely exported goods were organic and inorganic chemicals, and least exported was cereals.
Commodity Wise Export from China to India in 2021
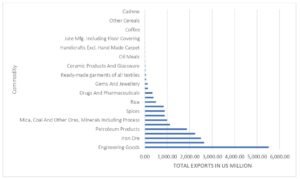
Fig.4 Total Export Apr’21 – Mar’22
The above figure shows the goods that were exported in the year 2021 from India to China. The total of meat, dairy, other cereals and tobacco exported falls below 1US million. Gems and jewellery, and Leather were exported at an amount of 120.3 US million and 134.41US million. Drugs and plastic were exported at an amount of 342.89 US million and 386.21US million. Rice was exported at an amount of 495.55 US million. Cotton yarn, spices, and electronic goods were exported in amounts of 839.91,887.19,889.73 US million, respectively. Mica, coal and other ores were exported at an amount of 988.72 US million. Marine products and petroleum products were exported at an amount of 1121.35 US million and 1871.11 US million. Organic and inorganic chemicals, iron ore, and others are exported in amounts of 2237.65,2503.09,2637.51 US million, respectively. Engineering goods are exported for an amount of 5517.94 US million. The most largely exported goods were engineering goods, and the least exported were cereals and meat, dairy, and poultry products.
Commodity-wise Export from China to India in 2022
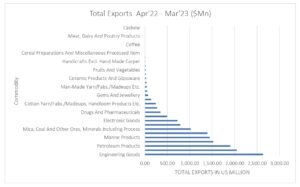
Fig.5 Total Export Apr’22 – Mar’23
The above figure shows the goods that were exported in the year 2022 from China to India. The total of other cereals, meat, dairy and tobacco exported falls below 1US million. Oil seeds, man-made yarn, readymade garments, gems and jewellery are exported by an amount of 37.27, 41.63,55.52,71.62 US million respectively. Leather, cotton yarn, and plastic are exported at amounts of 141.67,244.9,275.2 US million, respectively. Drugs, rice, electronic goods, and spices are exported in amounts of 348.14,496.24,725.72,793.41 US million, respectively. Mica, coal, iron ore, marine products, organic and inorganic products, and petroleum products are exported at amounts of 1020.92,1395.96,1445.56, and 1525.03,1906.25 US million, respectively. Other goods and engineering goods are exported by an amount of 2047.19 US million and 2631.89 US million, respectively. The most exported goods were engineering goods, and the least exported were cereals.
Commodity-wise Export from China to India in 2023
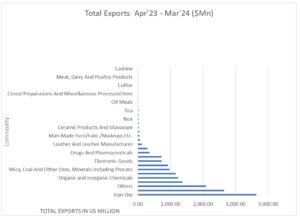
Fig. 6 Total Exports Apr’23 – Mar’24
The above figure shows the goods that are exported in the year 2023 from China to India. The total of cereals, meat, dairy and tobacco exported falls below 1US million. The amount of coffee, jute manufacturing and cereal preparation and handicrafts are exported by amounts of 2.09,3,6.32,9.02 US million, respectively. Leather, plastic and drugs are exported in amounts of 133.12,298.6,358.88 US million, respectively. Cotton yarn, electronic goods are exported by an amount of 730.85,732.37 US million, respectively. Spices, mica and coal are exported by an amount of 928.37 and 978.81 US million, respectively. Petroleum products, organic and inorganic chemicals, and marine products are exported in amounts of 1,165.65,1236.22,1377.75 US million, respectively. Other goods and engineering goods, and iron ore are exported by an amount of 2091.19,2651.23,3635.94 US million, respectively. The most exported good was iron ore, and the least exported was cereals.
Commodity-wise Imports by China from India in 2020
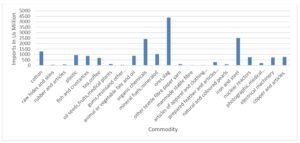
Fig.7 Items imported to China in 2020
The above figure represents the items that were imported by China from India in 2020. The largest items that are imported to China from India are ores and slag, amounting to 4382.42 US million, showing a rise of 2025.45 US million compared to 2019. The second largest item imported was iron and steel, amounting to 2512.55 US million showing a rise of 1998.64 US million compared to 2019. The third largest item imported was organic chemicals by an amount of 2416.35 US million, showing a decline of 286.09 US million compared to 2019. The fourth largest item imported is cotton, amounting to 1277.24 US million, showing a rise of 499.28 million compared to 2019. The fifth largest imported item is mineral fuels and mineral oil, which amounts to 1046.55 US million, showing a rise of 10482.02 US million compared to 2019.
Commodity-wise Imports to China from India in 2021
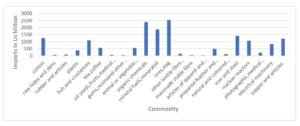
Fig.8 Items imported by China in 2021
The above figure represents the items that were imported by China from India in 2021. The largest imported item was ores and slags, which amounts to 2535.62 US million, showing a decline of 18.46 US million compared to 2020. The second largest imported item was organic chemicals were imported by an amount of 2380.27 US million, showing a decline of 36.08 US million compared to 2020. The third largest imported item was mineral fuels, mineral oil, which was imported for an amount of 1874.67 US million, showing a rise of 828.12 US million compared to 2020. The fourth largest is iron and steel, amounting to 1412.19 US million showing a rise of 1100.36 US million compared to 2020. The fifth largest imported item is cotton, amounting to 1254.72 US million, showing a decline of 23.24 US million compared to 2020.
Commodity-wise Imports By China from India in 2022
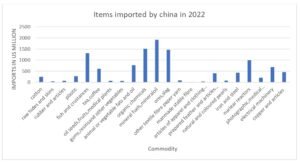
Fig.9 Items imported by China in 2022
The above figure represents the items that were imported by China from India in 2022. The largest imported item was mineral fuels, mineral oil, which was imported in an amount of 1911.98 US million, showing a rise of 37.31 US million compared to 2021. The second largest imported item was organic chemicals were imported by an amount of 1513.64 US million, showing a decline of 866.63 US million compared to 2021. The 3rd largest imported item was ores and slags, which amounts to 1467.11 US million, showing a decline of 1068.51 US million compared to 2021. The fourth largest import was fish and crustaceans, which amounts to 1309.91 US million, showing a rise of 217.16 US million compared to 2021. The fifth largest import was nuclear reactors, amounting to 995.45 US million, showing a decline of 72.08 US million compared to 2021.
Commodity-Wise Imports By China from India in 2023
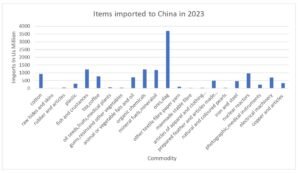
Fig. 10 Items imported to China in 2023
The above figure represents the items that are imported by China from India during 2023. The largest import was of ores and slags, which amounts to 3702.13 US million, showing a rise of 2235.02 US million compared to 2022. The second largest import was organic chemicals, which amounts to 1214.71 US million, showing a decline of 271.93 US million compared to 2022. The third largest import was mineral fuels, mineral oil, which was imported for an amount of 1173.58 US million, showing a decline of 738.4 US million compared to 2022. The fourth largest import was fish and crustaceans, which was imported by an amount of 1214.03 US million, showing a decline of 97.88 US million compared to 2022. The fifth largest imported item is nuclear reactors imported by an amount of 960.50 US million, showing a decline of 34.95 US million compared to 2022.
Findings
- In the year 2020, even though India was financially affected due to lockdown, its imports were rising more than its exports. This was because India’s pharmaceutical industry is the 14th largest in terms of value, but it is highly dependent on China for its raw materials for the pharmaceutical industry.
- Imports from China are increasing because of cheap imported goods, which are highly favourable for lower-income groups.
- Exports from China are typically high because it is focused on the export of manufactured items, whereas India mainly exports primary products thus which leads to a huge trade deficit.
- The year 2023 exhibited a smaller trade deficit compared to 2022. This is because India’s merchandise trade has declined, and China has been facing an economic slowdown.
- The year 2022 exhibited a rise in India’s imports from China due to its low-cost continuous dependence on Chinese goods and a rise in demand for intermediate goods.
- The commodity-wise export analysis from China to India shows that the largely imported goods from China to India are Engineering goods, iron ores, organic and inorganic chemicals and petroleum products. Organic chemicals are mainly used in the pharmaceutical industry.
Conclusion
The trade relationship between India and China is complicated, reflected in their growing economic interdependence and considerable challenges. Over the past twenty years, China has been India’s largest trading partner, with bilateral trade surpassing $100B in recent years. India imports from China, including machinery, equipment, chemicals, and electronics. On the other hand, India’s exports to China include iron ore, agricultural products, and other primary materials, indicating no value-added exports. So, to reduce the deficit, India must work toward expanding its exports to China in key industries like pharmaceuticals, IT services, while decreasing its reliance on imports from China, especially in key sectors like electronics and telecom.
References
Anil, A. (2020). Impact of COVID-19 on India-China trade. In N. Chandran (Ed.), CPPR-CSS WORKING PAPER 003/2020. Centre for Public Policy Research. https://www.cppr.in/wp-content/uploads/2020/07/CPPR-CSS-working-paper-003-2020.pdf
Dar, A. A., Mehta, S., Dar, A. A., & Mehta, S. (2020). A study of India-China trade relations. In Apex University, International Journal of Political Science and Governance, 2(2), 10–14.
Das, R. & Unity College Dimapur. (2018). A study on the trade relation between India and China. In International Journal of Creative Research Thoughts, 6(1), 618-619). https://ijcrt.org/papers/IJCRT1802417.pdf
Directorate General of Foreign Trade. (n.d.). Niryat portal. Retrieved June 24, 2025, from https://niryat.gov.in/
Embassy of India, Beijing. (n.d.). https://www.eoibeijing.gov.in/eoibejing_pages/Mjg
Embassy of India, Beijing. (n.d.-c). https://www.eoibeijing.gov.in/eoibejing_pages/MjQ
Ghosh, S., Agarwal, M., & Banerjee, A. (2019). India–China trade: asymmetrical developments and future prospects. South Asia Economic Journal, 20(1), 70-93. https://doi.org/10.1177/1391561419840137
Government of India, Ministry of Commerce. (n.d.). https://tradestat.commerce.gov.in/eidb/Icntcom.asp
To cite this article
Meenakshi S. Raj, & Thushara George. (2025). Understanding Indo-China Trade: Trends, Patterns, Challenges and Future Directions. Sparkling International Journal of Multidisciplinary Research Studies, 8(3), 9-21.