REVIVING LAKSHADWEEP DIALECT THROUGH FILMS: PROSPECTS AND IMPACTS OF SINJAR
December 31, 2021A STUDY ON CUSTOMER SATISFACTION TOWARDS GOLD LOANS OFFERED BY NBFCs WITH SPECIAL REFERENCE TO MANAPPURAM FINANCE LIMITED IN KANNIYAKUMARI DISTRICT
December 31, 2021REVIVING LAKSHADWEEP DIALECT THROUGH FILMS: PROSPECTS AND IMPACTS OF SINJAR
December 31, 2021A STUDY ON CUSTOMER SATISFACTION TOWARDS GOLD LOANS OFFERED BY NBFCs WITH SPECIAL REFERENCE TO MANAPPURAM FINANCE LIMITED IN KANNIYAKUMARI DISTRICT
December 31, 2021Sparkling International Journal of Multidisciplinary Research Studies
FINANCIAL LITERACY AND STOCK MARKET PARTICIPATION IN INDIA
Muniza Ahmad
Research Scholar, Department of Business Administration, Aligarh Muslim University, Aligarh, Uttar Pradesh, India.
Abstract
The study aims to examine the relationship between financial literacy and the stock market participation in India. The participation in the Stock market includes investment in Stocks as well as Mutual Funds. The study is based on a survey of 408 Indian households. Financial Literacy is measured using objective measures of basic and advanced financial knowledge. Logistic regression was conducted to measure the relationships. The results show that there is a significant and positive influence of financial literacy. Moreover, the socio-demographic variables such as Investment experience, gender, marital status and income exhibit strong relationship with stock market participation. The study has implications for investors, financial services sector, government and policy makers in understanding the reason behind low stock market participation and devising strategies for boosting financial literacy.
Keywords: financial literacy, stock market participation, india, stockholdings, investment, stocks, mutual funds.
Introduction
Investment in stocks gives high returns as compared to other investment options and helps to increase the saving. Yet, the stock market participation is low in India according to the report by Central Depository Services Ltd. (CDSL), which reveals that India has only about 3.7 per cent investment in equities in December 2020, as compared to 12.7 per cent in China and 55 per cent in US (either individually or through a mutual fund, assuming one account per person) (Mazumdar and Acharya, 2021). Similarly, according to NSE data (2020), only 8 crore Indian households invests in Mutual Funds. Only 12% of GDP of India comprises of Indian Mutual Fund Market Assets.
The Financial Literacy is assumed significant as it helps in managing personal finance, understanding of complex financial products (Rooij, Lusardi & Alessi, 2007) and prevention of financial frauds (Beal & Delpachitra, 2003).
Several reasons have been identified for low stock market participation that are income risk, inertia, short sale constraints and shift from expected utility maximization (Haliassos and Bertaut, 1995), lack of wealth with younger population to invest in stock market (Constantinides, Donaldson, and Mehra, 2002), life-cycle considerations and gap between lending and borrowing rates (Davis, Kubler, and Willen, 2006), trust and culture differences (Guiso, Sapienza, and Zingales, 2008), influence of peers and neighbours (Hong, Kubik, and Stein, 2004; Brown et al., 2008), limited numeracy skills, cognitive ability and intelligence quotient (IQ) (Christelis, Jappelli, and Padula, 2010; Grinblatt, Keloharju, and Linnainmaa, 2011) and lack of awareness about financial products (Guiso and Jappelli, 2005). Moreover, a number of studies indicate that low financial literacy causes lowstock market participation (Rooij, Lusardi and Alessi, 2007; Van Rooij et al., 2011; Arrondel et al., 2015; Mouna and Jarboui, 2016; Chu et al., 2017; Liao et al., 2017; Thomas and Spataro, 2018 and Zhu and Xiao, 2021). In India, Mate and Dam (2017) reported that financial literacy as a reason behind low stock market participation in Pune city. However, the study had lack of rigour. Hence, there is paucity of such studies in Indian context. This acts as a primary motivation for undertaking the present study.
This paper is organized as follows. Section 2 deals with the literature review. The researcher explains about data in Section 3 and methodology in Section 4. In Section 5, the investigator brings out the estimated results. Section 6 concludes this paper.
Literature Review
The pioneering studies on financial literacy by Bernheim (1995, 1998) reported low level of Financial Literacy among US consumers. Several studies reported lack of knowledge of basic concepts such as stocks, bonds and mutual funds in US households (Hilgert, Hogarth and Beverly, 2003), terms and conditions of consumer loans and mortgages (Moore, 2003). Similarly, other studies have also highlighted the lack of financial literacy worldwide (NCEE, 2005; Mandell, 2008; OECD INFE, 2011, 2013; Smith and Stewart, 2008; Christelis, Jappelli, and Padula, 2010 and Miles, 2004).
Cocco, Gomez and Maenhout (2005) argued that lack of participation in stock market is detrimental to financial wellbeing. Van Rooij et al. (2011) reported that higher financial sophistication leads to increase in wealth and probability of investment in stocks.
Rooij, Lusardi and Alessi (2007) performed survey to measure financial literacy and its relationship with stock market participation and reported that those having low level of literacy are much less likely to invest in stocks. Van Rooij et al. (2011) surveyed Dutch households and find that those with low financial literacy much less likely invest in stocks. Thomas and Spataro (2018) and Arrondel et al. (2015) studied from nine European countries and documented positive and significant influence of financial literacy on stock market participation. Similar results were also reported in China (Chu et al. 2017; Liao et al. 2017; and Zhu and Xiao, 2021) and in Tunisia (Mouna and Jarboui, 2016). Yamori and Ueyama (2021) surveyed Japanese households and found that high financial literacy increases the stock market participation.
The above-mentioned studies underline that low financial literacy leads to the low stock market participation. There is dearth of studies in India and therefore, we investigate the effect of low financial literacy on stock market participation in India. The present study contributes to fill the void in the Indian setting.
Data
We have collected the data from the sample of 408 Indian households having minimum high school qualification and holding bank account. The geographical spread of the respondents spanned across the West, North and Central and South India. For collecting the data, convenience sampling method has been chosen. The questionnaire was self-administered. Most of the data was collected through survey by email and the rest was done by direct face-to-face personal interview and telephonic interviews.
The Financial Literacy is assessed using 16 objective measures of basic and advanced financial knowledge taken from the study of Van Rooij et al. (2011). The questionnaire includes 5 Basic and 11 advanced questions. The Basic questions include the Big Three questions (Lusardi and Mitchell, 2014). The basic financial literacy questions assess the numeracy and understanding of basic financial concepts. The advanced items test knowledge about investment assets. It is calculated as the sum of the total number of correct responses out of 16, each correct response is given the score of 1 and incorrect as 0. The respondents were categorized on the basis of level of financial literacy i.e., low, medium and high. The method used for scoring and categorization of financial literacy is devised by Atkinson and Messy (2012) for the OECD INFE study (table 2).
Methodology
The logistic regression is used to test the effect of financial literacy on participation in stock market through investment in stocks and mutual funds. The logistic regression equations used are:

First, the regression of stock market participation with each socio-demographic variables and financial literacy is carried out separately. Then, the multiple effect is noted by performing the regression of stock market participation along with all the socio-demographic variables combined together and lastly after incorporating all the socio-demographic variables along with financial literacy in the equation, respectively. The stock market participation is represented by two dependent variables i.e., Investment in Stocks ( and Investment in Mutual Funds ( ). These are dichotomous variables having value 1 if participated and 0 otherwise. Eight socio-demographic variables included are Age, Gender, Marital Status, Education, Subject of study, Occupation, Annual Average Income and Investment experience and are denoted as in the equation. Financial Literacy is denoted as . The regression for stock investment and Mutual Fund Investment is conducted separately.
Results and Discussion
Table 1 provides the mean and standard deviation of the variables in the study.
Table 1. Summary of statistics of the estimation sample
| Mean | Std. Deviation | Minimum | Maximum | |
| Age | 2.25 | 1.085 | 1 | 5 |
| Male | 0.69 | 0.462 | 0 | 1 |
| Married | 0.75 | 0.435 | 0 | 1 |
| Education (graduation or higher) | 0.95 | 0.226 | 0 | 1 |
| Subject (Business and Economics) | 0.30 | 0.459 | 0 | 1 |
| Occupation (Salaried) | 0.60 | 0.491 | 0 | 1 |
| Annual Average Income | 2.72 | 1.492 | 1 | 6 |
| Investment experience | 2.95 | 1.973 | 0 | 6 |
| Financial Literacy | 9.30 | 3.768 | 0 | 16 |
| Investment in Stocks | 0.29 | 0.456 | 0 | 1 |
| Investment in Mutual Funds | 0.29 | 0.456 | 0 | 1 |
| Number of observations | 408 |
Table 2. Stock Market Participation across subgroups
| Stock Investment | Mutual Funds Investment | Stock Investment | Mutual Funds Investment | ||
| Respondents (Total 408) | 29.4% | 29.4% | Occupation | ||
| Age | Salaried | 62.5% | 59.2% | ||
| 18-30 | 16.7% | 12.50% | Non- salaried | 37.5% | 40.8% |
| 31-40 | 46.7% | 42.50% | Income | ||
| 41-50 | 19.2% | 24.20% | Less than Rs 2.5 Lakhs | 15.0% | 10.0% |
| 51-60 | 9.2% | 11.70% | Rs 2.5 Lakhs to Rs 5 Lakhs | 30.8% | 25.0% |
| >60 | 8.3% | 9.20% | Rs 5 Lakhs to Rs 10 Lakhs | 20.0% | 26.7% |
| Gender | Rs 10 Lakhs to Rs 15 Lakhs | 13.3% | 14.2% | ||
| Male | 76.7% | 82.5% | Rs 15 Lakhs to Rs 20 Lakhs | 4.2% | 5.8% |
| Female | 23.3% | 17.5% | More than Rs 20 Lakhs | 16.7% | 18.3% |
| Marital Status | Investment Experience | ||||
| Single | 15% | 10% | Less than 1 year | 11.6% | 10.8% |
| Married | 85% | 90% | 1 to 3 years | 16.7% | 21.7% |
| Education | 4 to 6 years | 17.5% | 24.2% | ||
| Graduate and above | 95.8% | 95% | 7 to 9 years | 10.0% | 10.8% |
| Below Graduate | 4.2% | 5% | 10 to 15 years | 26.7% | 10.8% |
| Subject of Study | More than 15 years | 17.5% | 21.7% | ||
| Business & Economics | 42.5% | 39.2% | Financial Literacy | ||
| Others | 57.5% | 60.8% | Low | 22.5% | 19.2% |
| Average | 17.5% | 26.7% | |||
| High | 60.0% | 54.2% | |||
Table 2 provides the distribution of stock market participation directly through stocks and indirectly through mutual funds across socio-demographic variables and financial literacy. There are 29.4% of the respondents who have chosen to invest in stock and the equal proportion of respondents (i.e., 29.4%) have chosen to invest in mutual funds. Investment in both stocks and mutual funds is highest for the age group 31 to 40 years. This is in line with the studies by Bodie and Crane (1997), Campbell and Viceira (2002) and Van Derhei, Holden, and Alonso (2009). Additionally, the stock market participation increases with age until it reaches the 31-40 years group and then decreases with age, displaying hump shape. This is in conformity with the studies by Yoo (1994), Gomes and Michaelides (2005), Ameriks and Zeldes (2004) while showing contrast with the study by Constantinides, Donaldson and Mehra (2002).
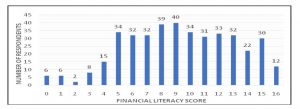
Figure 2 shows the distribution of financial literacy score. Only 2.9% of the respondents achieved the highest financial literacy score (answered all the questions correctly), out of 408 respondents. 1.6% of the respondents have the lowest financial literacy score (answered all questions incorrectly or “do not know”). The mean score of financial literacy is 9.3 and median is 9. It shows that the average level of financial literacy of the sample is medium (i.e., less than 60%)
Figure 1. Financial Literacy Score of Total Respondents
Males have better stock market participation as compared to females. The participation in stocks and mutual funds increases with the increase in the level of education and income and vice-versa. The stock participation is highest for those falling under income group “Rs. 2.5 lakhs to Rs. 5 Lakhs” and mutual fund participation is highest for income group “Rs. 5 lakhs to Rs. 10 Lakhs”. However, it is noteworthy that people having subject of study other than business and economics have higher stock market participation. In case of occupation, salaried people participate more in stocks and mutual funds than non-salaried ones. The stock market participation is highest for those having investment experience of 10 to 15 years for stocks and 4 to 6 years in case of mutual funds. Furthermore, it is noted that higher the financial literacy, higher is the stock market participation and vice-versa. It is the highest in the category of those having high financial literacy.
The table 3 and 4 exhibit logistic regression estimates of individual and multiple regression conducted to gauge the influence of socio demographic variables and financial literacy on the Stock Investment and Mutual Fund Investment respectively. The socio-demographic variables used as dummy in the regression equation are Gender, Marital Status, Education, subject of study and Occupation.
Stock Investment
Table 3. Regression between Socio-Demographic (SD) variables, financial literacy (FL) and control variables with Investment in Stocks.
| ||||||||||||||||||||||||||||||||||||||||||||||||||||||||||||||||||||||||||||||||||||||||||||||||||||||||||||||||||||||||||||||||||||||||||||||||||||||||||||||||||||||||
In table 3, the columns 1 to 8 represent the results of individual regression between socio-demographic variables and stock investment. Column 9 shows the coefficient of regression between Financial Literacy and Stock Investment. Column 10 shows the regression between stock investment and all socio-demographic variables taken together. The column 11 shows the result of regression between stock investment and all the independent variables by incorporating all the socio-demographic variables and financial literacy together.
In case of individual regressions, it is evident that Age (coefficient= 0.240, significant at 5%), Gender (coefficient= 0.980, significant at 1%), Marital Status (coefficient= 0.864, significant at 1%), Subject of study (coefficient= 0.796, significant at 1%), Annual Average Income (coefficient= 0.238, significant at 1%), Investment experience (coefficient= 0.304, significant at 1%)and Financial Literacy (coefficient= 0.194, significant at 1%) have significant and positive impact on Stock Investment.
When all the socio-demographic variables are combined together in the regression equation, it is observed that only three socio-demographic variables i.e., gender, subject of study and investment experience indicate significant relationship at 1% significance level with Stock Investment. However, when regression of stock investment is conducted by adding Financial Literacy along with all the socio-demographic variables, the coefficients of gender, experience and financial literacy remained positive and significant at 1%. It is noted that subject of study was also having positive and significant relationship with stock investment, but turned insignificant when financial literacy as a control variable was added along with other socio-demographic variables. However, education and occupation have insignificant influence on the stock market participation through stocks investment. Moreover, financial literacy also has positive and significant relationship at 1% significance level with Stock Investment individually as well as by controlling other socio-demographic variables in the regression equation. It is observed that the relationship of gender, experience and financial literacy have remained and significant throughout the stages of regression. The value of R-Squared increased 0.207(in column 11), when combining financial literacy along with all the socio-demographic variables. It means that 20% of the variation in Stock Investment can be explained by the model.
The major findings of the study reveal that gender has a significant relationship with Stock Investment which is in line with the previous studies such as Mankiw and Zeldes (1991), Yoo(1994), Haliassos and Bertaut (1995), Guiso, Haliassos, and Jappelli (2002), Campbell (2006), Almenberg and Dreber (2015) and Van Rooij, Lusardi, and Alessie (2011). The investment experience has positive and significant relationship with Stock Investment. Financial literacy plays positive and significant role in influencing stock market participation, which is in agreement with the result of other studies ofVan Rooij et al. (2011), Arrondel (2012, 2015), Almenberg and Dreber (2015), Thomas and Spataro (2015), and Xia, Wang, and Li (2014)).
Mutual Funds Investment
Table 4. Regression between Socio-Demographic (SD) variables, financial literacy (FL) and control variables with Investment in Mutual Funds.
| Standardized coefficient (significance) | |||||||||||
| Independent Variables | 1 | 2 | 3 | 4 | 5 | 6 | 7 | 8 | 9 | 10 | 11 |
| SD | SD+FL | ||||||||||
| Age | 0.435** | 0.104 | 0.055 | ||||||||
| Gender (dummy) | 0.512* | 0.327 | 0.255 | ||||||||
| Marital Status (dummy) | 1.425** | 0.951* | 0.963* | ||||||||
| Education (dummy) | 0.111 | -0.516 | -0.756 | ||||||||
| Subject of study (dummy) | 0.586** | 0.482* | 0.210 | ||||||||
| Occupation (dummy) | -0.023 | -0.272 | -0.195 | ||||||||
| Annual Average Income | 0.397** | 0.302** | 0.214* | ||||||||
| Investment experience | 0.304** | 0.114 | 0.129* | ||||||||
| Financial Literacy | 0.194** | 0.144** | |||||||||
| R squared | 0.047 | 0.011 | 0.056 | 0.000 | 0.016 | 0.000 | 0.071 | 0.068 | 0.090 | 0.129 | 0.164 |
Dependent Variable: Investment in Mutual Funds (Dummy: Yes=1, No= 0) Significance is shown as 1% (**) and 5% (*) Dummy description: Gender: Male=1, Female= 2; Marital Status: Married= 1, Unmarried= 0; Education: Graduate and above= 1, Below Graduate= 0; Subject of Study: Business and Economics= 1, Others= 0; Occupation: Salaried=1, non-Salaried= 0 | |||||||||||
Table 4 exhibits the result of regression estimates of socio-demographic variables and financial literacy on stock market participation through mutual funds. The columns 1 to 8 show the regression coefficient of individual socio-demographic variables on Mutual Fund Investment. The column 9 shows the coefficient of individual regression between Financial Literacy and Mutual Funds Investment. Column 10 shows the coefficients of regression between Mutual Funds investment and all socio-demographic variables combined together in the equation. The column 11 provides the result of regression between mutual funds investment and all the independent variables by incorporating all the socio-demographic variables and financial literacy together. It is evident from the table 4 that Age (coefficient= 0.435, significant at 1%), Gender (coefficient= 0.512, significant at 5%), Marital Status (coefficient= 1.425, significant at 1%), Subject of study (coefficient= 0.796, significant at 1%), Annual Average Income (coefficient= 0.238, significant at 1%), Investment experience (coefficient= 0.304, significant at 1%) and Financial Literacy (coefficient= 0.194, significant at 1%) have significant positive impact on Mutual Fund Investment in case of individual regression. However, column 10 shows that there exists positive and significant relationship of Mutual Fund Investment with income at 1% significance level and with marital status and subject of study at 5% significance. Furthermore, on incorporating financial literacy along with socio-demographic variables, positive relationship of mutual fund investment is demonstrated with financial literacy at 1% significance level and with Marital Status, Income and investment experience at 5% significance level. The significance of subject of study disappeared when all the socio-demographic variables are combined with financial literacy in the regression. However, the effect of education and occupation on mutual fund investment is insignificant.
The researcher finds out that those who are financially literates, married and possessed high investment experience and annual average income more than Rs. 10 Lakhs are more likely to invest in mutual funds. Moreover, financial literacy is significant at 1% level and marital status and annual average income which are significant at 5% level implies that these factors exhibit positive relationship with mutual fund investment, with or without including the financial literacy along with socio-demographic variables in the regression equation. In column 11, R-Squared value increased to 0.164, when all the independent variables in the regression were included, indicates 16.4% of the variation in Mutual Funds Investment can be explained. Hence, marital status, annual average Income, investment experience and financial literacy are the most important predictors of Mutual Funds Investment found in the study.
The findings of the study are consistent with the studies of the past. For instance, the researcher observes that the married have more stock market participation through mutual funds than the unmarried is supported by Van Rooij, Lusardi, and Alessie (2011), Haliassos and Bertaut (1995), Guiso, Haliassos, and Jappelli (2002) and Campbell (2006). Income which has a positive effect on investment in mutual funds is also supported by Campbell (2006). Financial literacy positively influences the stock market participation through mutual funds, which is in line with the studies by Van Rooij et al. (2011), Arrondel (2012, 2015), Almenberg and Dreber (2015), Thomas and Spataro (2015), and Xia, Wang, and Li (2014). Moreover, the effect of age and gender gap disappeared with the inclusion of financial literacy and other socio-demographic variables as control variables in case of mutual fund investment.
Conclusion
The present study investigates to find the factors of stock market participation in equity stocks and mutual funds. The study documents low financial literacy among Indian households as they have limited knowledge of stocks, mutual funds, risk diversification and the working of financial markets. The participants of the stock market are predominantly male, married, aged between 31-40 years and belongs to the upper middle class income group. They also have higher financial literacy as compared to the non- participants.
The regression analysis yields that gender, investment experience and financial literacy are significantly related to stock market participation in case of stocks. Moreover, marital status, investment experience, annual average income and financial literacy have a strong relationship with Mutual Funds investment. However, education and occupation has shown no hint of evidence in relationship with stock market participation either through stocks or mutual funds. Hence, investment experience is the most important socio-demographic factor that influences the stock market participation.
Taken together, the study provides evidence that financial literacy is a crucial determinant of stock market participation in India. However, the findings may be affected by including other dimensions of financial literacy such as financial attitude and financial behaviour. Additionally, the study only pertains to objective measures of financial literacy. Moreover, the subjective measures of financial literacy may impact stock market participation. In addition, the results may be altered by including other factors such as number of investment assets in the portfolio, sources of financial advice and interest in types of financial information.
Furthermore, the measure of stock market participation is self-reported. The findings may differ from the actual figures of stock market participation. Also, the percentage values of stock market participants in stocks and mutual funds across subgroups are not mutually exclusive. The study has implications for investors, financial services sector, government and policy makers in understanding the reason behind low stock market participation.
References
Ameriks, J., & Zeldes, S., P. (2004). How do household portfolio shares vary with age, 1-87. working paper, Columbia University.
Arrondel, L., Calvo Pardo, H., F., & Tas, D. (2014). Subjective return expectations, information and stock market participation: Evidence from France. Information and Stock Market Participation: Evidence from France, March 14, 2014.
Arrondel, L., Debbich, M., & Savignac, F. (2015). Stockholding in France: the role of financial literacy and information. Applied Economics Letters, 22(16), 1315-1319.
Beal, D., & Delpachitra, S. (2003). Financial literacy among Australian university students. Economic Papers: A journal of applied economics and policy, 22(1), 65-78.
Bernheim, B. D., & Garrett, D. M. (2003). The effects of financial education in the workplace: Evidence from a survey of households. Journal of public Economics, 87(7-8), 1487-1519.
Campbell, J. Y. (2006). Household finance. The journal of finance, 61(4), 1553-1604.
Christelis, D., Jappelli, T., & Padula, M. (2010). Cognitive abilities and portfolio choice. European Economic Review, 54(1), 18-38.
Cocco, J. F., Gomes, F. J., & Maenhout, P. J. (2005). Consumption and portfolio choice over the life cycle. The Review of Financial Studies, 18(2), 491-533.
Davis, S. J., Kubler, F., &Willen, P. (2006). Borrowing costs and the demand for equity over the life cycle. The Review of Economics and Statistics, 88(2), 348-362.
Gomes, F., & Michaelides, A. (2005). Optimal life‐cycle asset allocation: Understanding the empirical evidence. The Journal of Finance, 60(2), 869-904.
Grinblatt, M., Keloharju, M., & Linnainmaa, J. (2011). IQ and stock market participation. The Journal of Finance, 66(6), 2121-2164.
Guiso, L., Haliassos, M., & Jappelli, T. (Eds.). (2002). Stockholding in Europe. Springer.
Guiso, L., & Jappelli, T. (2005). Awareness and stock market participation. Review of Finance, 9(4), 537-567.
Guiso, L., Sapienza, P., & Zingales, L. (2008). Trusting the stock market. The Journal of Finance, 63(6), 2557-2600.
Haliassos, M., & Bertaut, C., C. (1995). Why do so few hold stocks?. The Economic Journal, 105(432), 1110-1129.
Hilgert, M. A., Hogarth, J. M., & Beverly, S. G. (2003). Household financial management: The connection between knowledge and behavior. Fed. Res. Bull., 89, 309.
Hong, H., Kubik, J. D., & Stein, J. C. (2004). Social interaction and stock‐market participation. The Journal of Finance, 59(1), 137-163.
Jappelli, T., & Padula, M. (2013). Investment in financial literacy and saving decisions. Journal of Banking & Finance, 37(8), 2779-2792.
Lusardi, A., & Mitchell, O. S. (2014). The economic importance of financial literacy: Theory and evidence. Journal of economic literature, 52(1), 5-44.
Mandell, L. (2008). Financial literacy of high school students. In Handbook of consumer finance research, 163-183. Springer, New York, NY.
Mankiw, N. G., & Zeldes, S. P. (1991). The consumption of stockholders and non-stockholders. Journal of financial Economics, 29(1), 97-112.
Mate, R., M., & Dam, L. (2017). Role of an attitude and financial literacy in stock market participation. International Journal of Management, IT & Engineering, 7(8)
Mazumdar and Acharya. “Millions of millennials are piling into India’s stock market, shows data.” Business Standard (Mumbai), March 25, 2021
Miles, D. (2004). The UK mortgage market: Taking a longer-term view. Final Report and Recommendations.
Moore, D., L. (2003). Survey of financial literacy in Washington State: Knowledge, behavior, attitudes, and experiences. Washington State Department of Financial Institutions.
National Council on Economic Education (NCEE) (2005). What American Teens and Adults Know about Economics. Washington, DC: NCEE
OECD. (2011). Measuring financial literacy: questionnaire and guidance notes for conducting an internationally comparable survey of financial literacy.
OECD. (2012). OECD/INFE toolkit to measure financial literacy and inclusion guidance, core questionnaire and supplementary questions.
Smith, B., A., & Stewart, F. (2009). Learning from the Experience of Organisation for Economic Co-operation & Development Countries: Lessons for Policy, Programs, and Evaluations. In Overcoming the Saving Slump, 345-368. University of Chicago Press.
Thomas, A., & Spataro, L. (2015). Financial literacy, human capital and stock market participation in Europe: An empirical exercise under endogenous framework. 2015. Available 12 March 2012. Retrieved from University of Pisa website: http://www.ec.unipi.it/docum ents/Ricerca/papers/2015-194. pdf.
Thomas, A., & Spataro, L. (2018). Financial literacy, human capital and stock market participation in Europe. Journal of Family and Economic Issues, 39(4), 532-550.
VanDerhei, J., Holden, S., & Alonso, L. (2009). 401 (k) plan asset allocation, account balances, and loan activity in 2008. EBRI Issue Brief, 335.
Alessie, R., Lusardi, A., & Van Rooij, M. (2007). Financial literacy and stock market participation. National Bureau of Economic Research.
Van Rooij, M., Lusardi, A., & Alessie, R. (2011). Financial literacy and stock market participation. Journal of Financ ial Economics, 101(2), 449-472.
Vissing-Jorgensen, Annette. (2004). “Perspectives on behavioral finance: Does “irrationality” disappear with wealth? Evidence from expectations and actions.” NBER Macroeconomics Annual 18, 139–208.
Xia, T., Wang, Z., & Li, K. (2014). Financial literacy overconfidence and stock market participation. Social indicators research, 119(3), 1233-1245.
Yamori, N., & Ueyama, H. (2021). Financial Literacy and Low Stock Market Participation of Japanese Households. Finance Research Letters, 102074.
Yoo, P., S. (1994). Age dependent portfolio selection, 1994-003.
Zhu, T., & Xiao, J., J. (2021). Consumer financial education and risky financial asset holding in China. International Journal of Consumer Studies.
To cite this article
Muniza Ahmad. (2021). Financial Literacy and Stock Market Participation in India. Sparkling International Journal of Multidisciplinary Research Studies, 4(4), 8-21.